

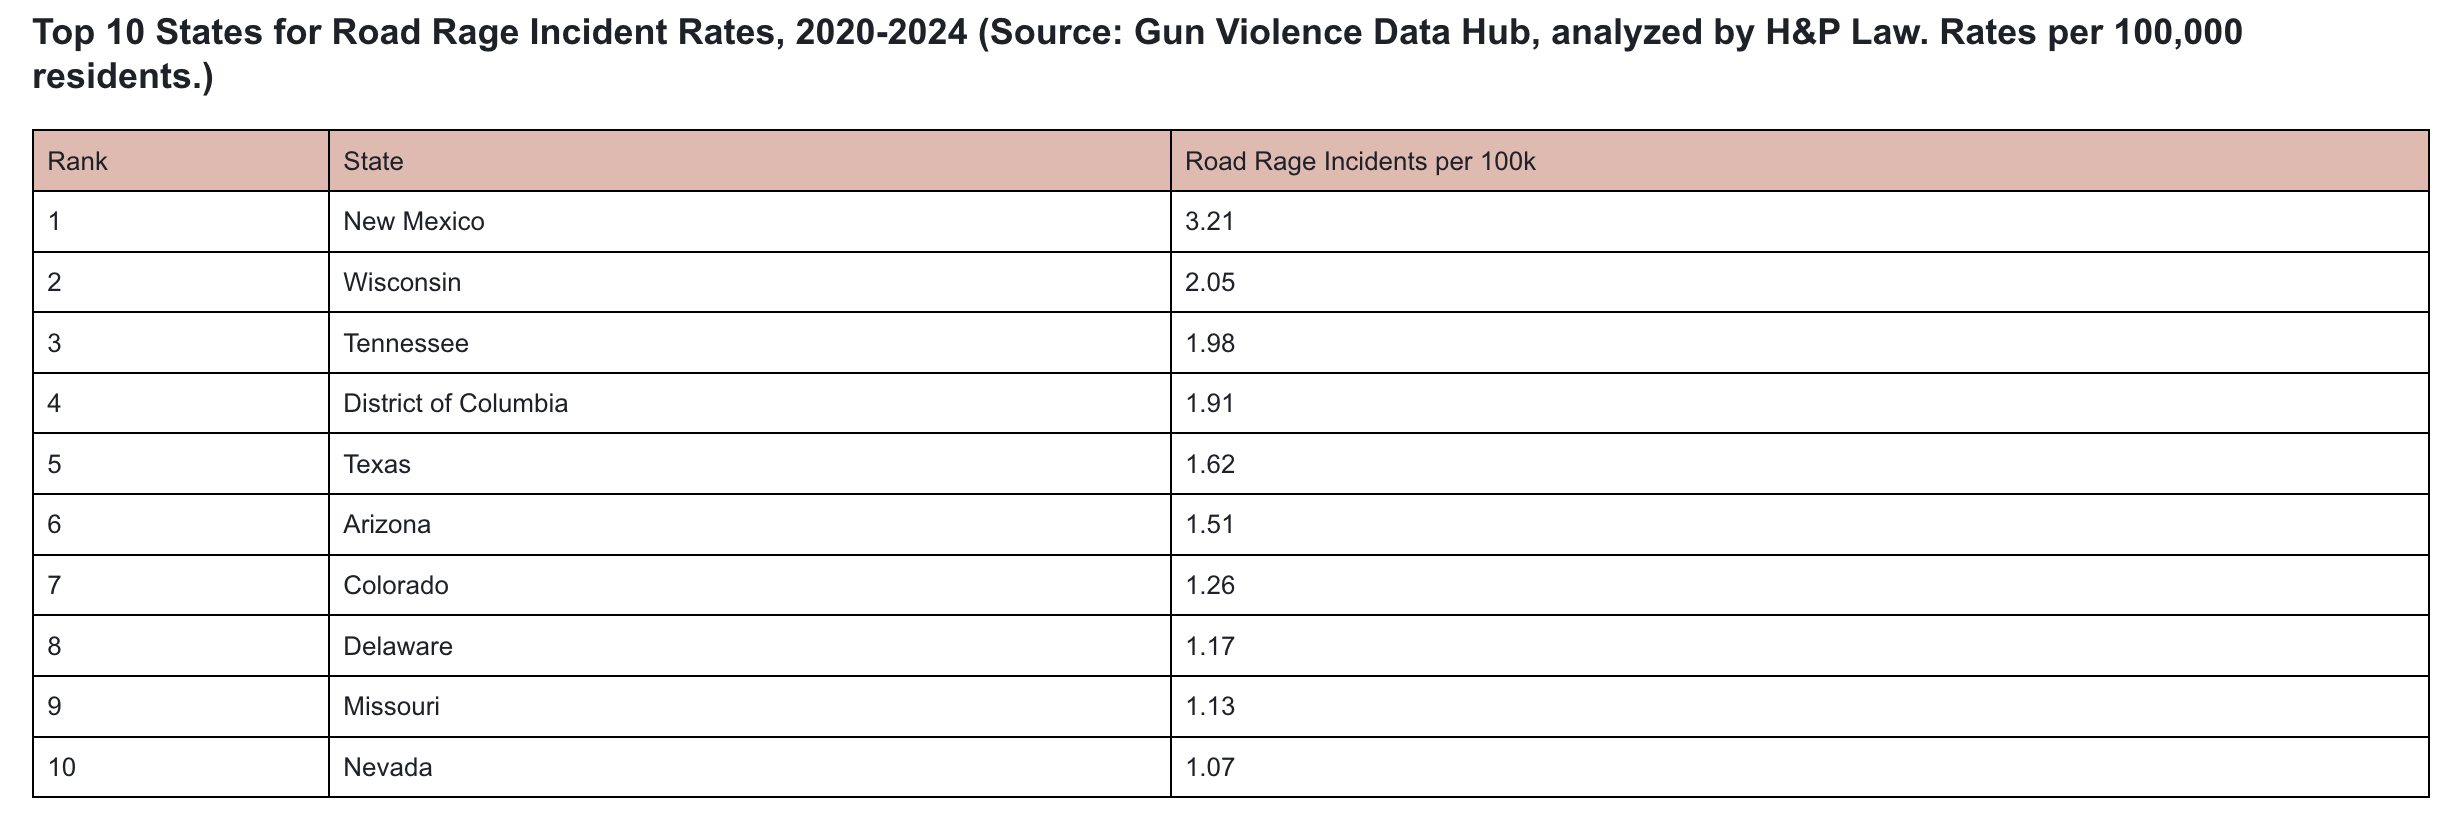
A new study finds New Mexico ranks 1st in the country for road rage incidents. New Mexico recorded 3.21 incidents per 100,000 residents between 2020 and 2024. That places it above Washington DC. Above Texas and Tennessee. Above Arizona.
The research by personal injury lawyers at H&P Law analyzed road rage incident data recorded across the United States between 2020 and 2024. Using incident counts and state population estimates, the study ranked the 10 states with the highest road rage incident rates per 100,000 residents. All figures are reported per 100,000 residents.
Key Findings:
- The US recorded 2,732 road rage incidents between 2020 and 2024
- Tennessee ranks 3rd nationally at 1.98 road rage incidents per 100,000 residents
- Tennessee ranks above Washington DC at 1.91, Texas at 1.62, and Arizona at 1.51
- Tennessee passed permitless carry legislation in 2021, the same period covered by this dataset
- Tennessee also ranks 3rd nationally for road rage shootings at 1.47 per 100,000 residents
Source: study was conducted by H&P Law, a personal injury law firm in Las Vegas.
1. New Mexico - 3.21 per 100,000
New Mexico leads the country by a wide margin. Its rate of 3.21 road rage incidents per 100,000 residents sits more than a full point ahead of Wisconsin in second place. Wide open highways, extreme heat, and permissive gun carry laws create conditions where road rage escalates faster than anywhere else. New Mexico is the only state in this dataset that sits in a category of its own.
2. Wisconsin - 2.05 per 100,000
Wisconsin ranks second at 2.05 per 100,000. Its placement is one of the most surprising results in the dataset. No Sun Belt highways. No extreme heat. No regional reputation for road violence. Yet Wisconsin records more road rage incidents per capita than every state except New Mexico. For a Midwest state, that ranking demands an explanation that the data alone does not easily provide.
3. Tennessee - 1.98 per 100,000
Tennessee ranks third at 1.98 per 100,000. It sits just 0.07 points below the 2.00 mark but remains firmly in the highest-risk tier nationally. Tennessee passed permitless carry legislation in 2021, meaning any driver can legally carry a loaded firearm in public without a permit or training requirement. That policy shift coincides directly with the five-year window this dataset covers. Tennessee's third-place ranking in road rage incidents and its third-place ranking in road rage shootings tell a consistent and connected story. For a state that passed permitless carry legislation in 2021, that ranking is not a coincidence. It is a direct consequence.
4. District of Columbia - 1.91 per 100,000
DC ranks fourth at 1.91 per 100,000. The District covers just 68 square miles and has no rural highways. Yet it records a road rage incident rate that sits just 0.07 points below Tennessee. DC's dense road network, heavy commuter flow, and daily gridlock create a pressure cooker driving environment that produces road rage at a rate that outpaces nearly every state in the country.
5. Texas - 1.62 per 100,000
Texas ranks fifth at 1.62 per 100,000. As the second most populous state in the country, Texas generates a high absolute volume of road rage incidents. Its permitless carry law, passed in 2021, means more drivers are legally armed than ever before. Despite all of that, Texas still ranks below Tennessee. That comparison is one of the more telling results in this dataset.
6. Arizona - 1.51 per 100,000
Arizona ranks sixth at 1.51 per 100,000. It completes a Southwest cluster that also includes New Mexico and Texas. Three neighboring states sharing three of the top six spots point to a clear regional pattern. Wide open highways, extreme heat, and permissive carry laws appear consistently across all three. Tennessee's third-place ranking shows that the South is producing road rage at rates that rival the entire Southwest cluster.
7. Colorado - 1.26 per 100,000
Colorado ranks seventh at 1.26 per 100,000. Its rapidly growing urban population along the Front Range corridor, particularly Denver and Colorado Springs, likely drives its placement. More people moving into urban areas means more drivers on roads that were not built for that volume. That combination of growth and congestion keeps Colorado in the top ten.
8. Delaware - 1.17 per 100,000
Delaware ranks eighth at 1.17 per 100,000. It is one of the smallest states in the country by both size and population. Its presence in the top ten shows that road rage rates are not shaped by population size alone. Delaware's compact road network and heavy interstate traffic through the Northeast corridor create the kind of high-friction driving environment that produces elevated incident rates.
9. Missouri - 1.13 per 100,000
Missouri ranks ninth at 1.13 per 100,000. Missouri eliminated its permit requirement for concealed carry in 2017, one of the earliest states to do so. Its continued presence in the top ten reflects the long-term impact of that policy shift on road-based conflict. Missouri's rate of 1.13 sits 75.2% below Tennessee's 1.98. That gap between two southern states with similar gun carry policies is one of the more interesting unanswered questions in this dataset.
10. Nevada - 1.07 per 100,000
Nevada rounds out the top ten at 1.07 per 100,000. Its rate sits above 1.00, keeping it firmly in the higher-risk category. Nevada's raw numbers add important context. Of 34 recorded road rage incidents between 2020 and 2024, 29 involved a shooting. That is an 85.3% shooting conversion rate per incident. Nevada may rank 10th overall. But when it comes to the likelihood that a road rage conflict ends with gunfire, its per-incident rate is one of the most alarming in the dataset.
Why Are Some States Seeing Higher Road Rage Rates?
Two factors shape this data more than any other. First, gun carry laws determine how many drivers are armed at any given moment. Tennessee passed permitless carry in 2021, meaning no license or training is required to carry a loaded firearm in public. When more drivers carry guns, more road rage incidents have the potential to turn into shootings. Second, traffic stress and road conditions act as an accelerant. High-congestion corridors, long commute distances, and rapid population growth in urban areas all increase the emotional intensity of driving conflicts. Nashville's explosive growth over the past decade has placed a rapidly expanding population onto a road network that was not built for that volume. When those conditions meet widespread gun carry, the result is what this data shows.
What This Means for Tennessee Drivers
Tennessee's third-place ranking is not an abstract statistic. It reflects what is happening on Tennessee roads every single day. The state recorded 1.98 road rage incidents per 100,000 residents between 2020 and 2024. That works out to roughly 38 road rage incidents every single week across the state. For everyday commuters driving in Nashville, Memphis, and Knoxville, that figure means the risk of encountering an aggressive confrontation behind the wheel is higher than in 47 other states. Tennessee also ranks 3rd for road rage shootings at 1.47 per 100,000 residents. That means more than 74% of those confrontations involve a gun. For Tennessee drivers, a road rage conflict is not just an uncomfortable moment. It is a situation where the other driver has a statistically meaningful chance of being armed. That is the road Tennessee commuters are navigating right now.
Methodology
This analysis was conducted by H&P Law, a personal injury law firm dedicated to public safety awareness and road safety advocacy. Road rage incident data recorded across the United States between 2020 and 2024 was analyzed and standardized by population size to calculate incident rates per 100,000 residents. States were then ranked based on these rates to identify where road rage incidents occur most frequently relative to population.
Data Sources:
- Gun Violence Data Hub Road Rage Incident Database (2020-2024) - gunviolencedatahub.org
- U.S. Census Bureau State Population Estimates - census.gov
- National Highway Traffic Safety Administration - nhtsa.gov
- AAA Foundation for Traffic Safety Culture Index - aaafoundation.org
- Federal Highway Administration Driver Behavior Studies - highways.dot.gov
- H&P Law Road Rage Incident Analysis - hpylaw.com
Matthew Pfau, Partner at H&P Law
Matthew began working in the field of Estate Planning immediately out of law school because he knew that this field was going to allow him to help people in a way that would positively impact the remainder of their lives. His passion for personal injury law grew after he realized it combined his love for client advocacy and helping individuals in need. Matthew is a zealous advocate for his clients, having completed numerous successful jury trials.
Matthew is a graduate of the University of Nevada, Las Vegas and Whittier Law School. He is a member in good standing with the State Bar of Nevada and the California State Bar Association and is admitted to practice in multiple district courts and federal courts. Matthew is committed to helping clients who have been injured by negligence, fighting to protect their rights in court.
Editorial comments expressed in this column are the sole opinion of the writer
